One invaluable problem diagnosing tool in all versions of Windows is the Task Manager. While it can't fix a problem, it can often point to the thing that needs to be fixed. Think of it as a constantly updating report that tells you the health of the main bits of your PC. Our HowTo guide this month will explain how to open the Task Manager and how to get at the important information it contains.
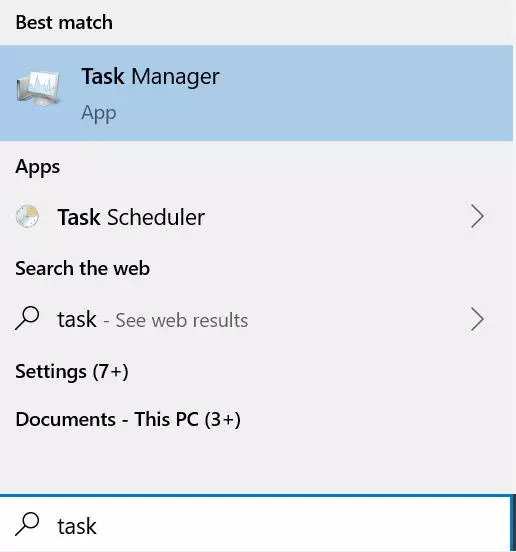
Step 1: Either start typing "Task Manager" into the search, or hit Control, Alt + Delete and pick Task Manager from the list that appears.
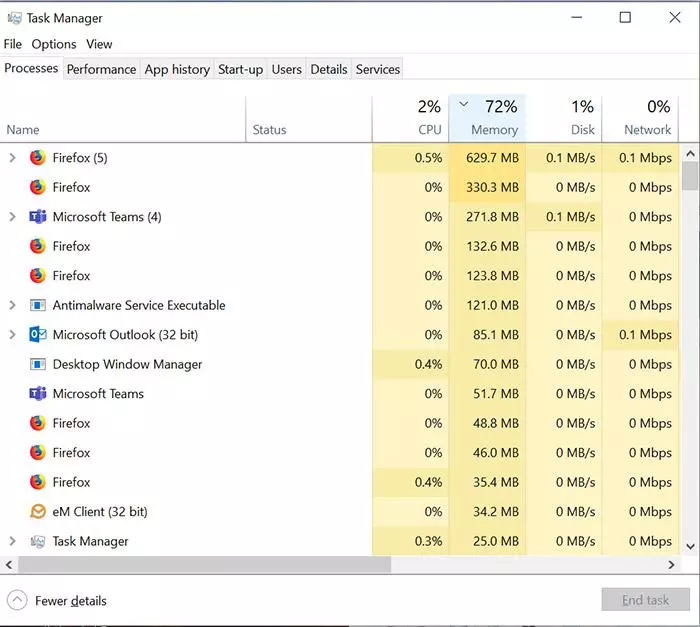
Step 2: Task Manager will open with the "Processes" tab open. I can instantly see here that memory usage is on the high side. I've clicked the top of the memory column, and it has reordered the list with the apps that are using most memory at the top.
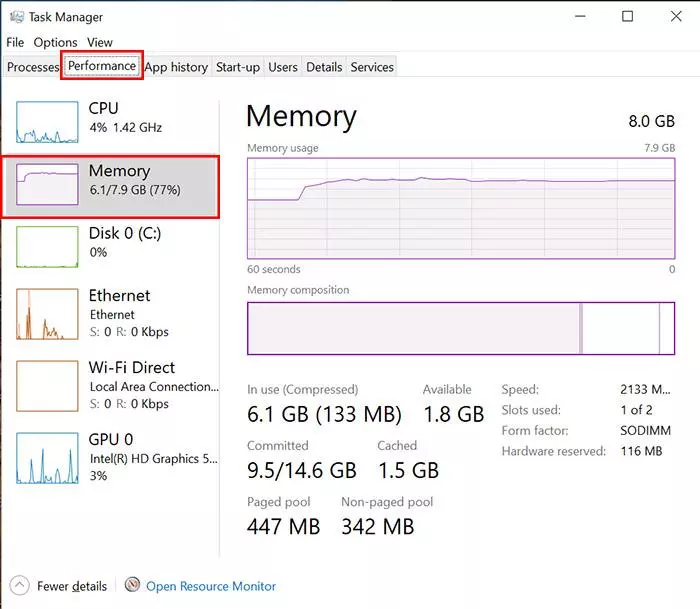
Step 3: Given the memory use is high, let's check the Performance tab for more information. Here, I've also clicked the Memory tab. I can see from the graph that there's a constant high usage. Given that Firefox is listed as the biggest memory user, let's try closing a load of my tabs and seeing what that does to the stats.
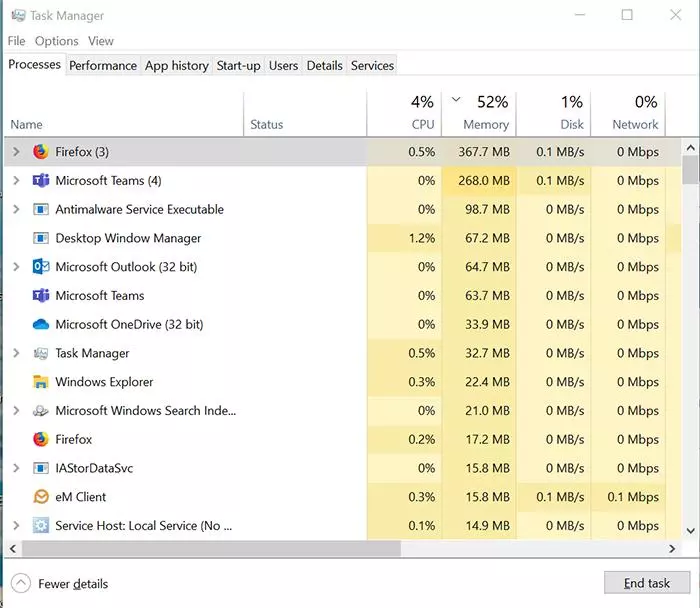
Step 4: Much better! Still top of the list, but using much less memory than before. While this example is specific to memory, the same principle applies to any of the resources here. If one of these are sitting on or near 100%, then your machine is being asked for more oomph than it can provide. Try seeing what the worst offenders are and closing these if possible.